An enterprise engineering team recently migrated its core microservices to cloud-native infrastructure, implemented automated CI/CD pipelines, containerized applications using Docker and Kubernetes, and adopted Infrastructure as Code (IaC). Leadership expected immediate engineering velocity. Yet, six months later, lead times remained unpredictable, production releases still required anxious Friday-night war rooms, and developers spent hours wrestling with manual configuration drift.
The organization had successfully adopted DevOps tools, but it had not achieved a measurable DevOps transformation.
Many technology organizations confuse tool adoption with true engineering capability. Without a rigorous, balanced approach to measuring DevOps transformation with metrics and analytics, teams risk optimizing superficial numbers—such as total deployment counts or pipeline builds—while ignoring actual software delivery performance, reliability, and business value.
What Is DevOps Transformation?
DevOps transformation is an organizational and engineering journey that modernizes how software is built, tested, secured, released, and operated. It is rarely the implementation of a single tool or platform. Instead, it involves deep cultural, procedural, and architectural changes spanning:
- Cross-functional collaboration between development, operations, QA, and security teams.
- Process automation across building, testing, and release management.
- Architectural shifts toward microservices, loose coupling, and cloud-native systems.
- Continuous monitoring, observability, and proactive feedback loops.
Transformation succeeds when engineering systems become faster, safer, and more sustainable, empowering developers to deliver value without burning out.
Why Measure DevOps Transformation?
Measurement is the compass of engineering evolution. Without data, decisions rely on anecdotes, loudest voices, or historical habits. Organizations measure DevOps transformation to:
- Understand objective progress rather than relying on subjective feelings.
- Identify bottlenecks and constraints in the software delivery lifecycle.
- Improve system reliability and reduce incident frequencies.
- Measure engineering efficiency and developer satisfaction.
- Support data-driven leadership decisions and resource allocation.
- Demonstrate clear business value to stakeholders.
Crucially, metrics should support continuous improvement rather than act as a weapon for blaming individuals or teams.
Metrics vs Analytics
Understanding the difference between metrics and analytics is vital for preventing dashboard fatigue.
Metrics
Metrics are measurable indicators that track a specific dimension of performance or system state at a given time. Examples include deployment frequency, lead time for changes, change failure rate, and mean time to restore.
Analytics
Analytics represent the process of interpreting that data over time. Analytics examine trends, patterns, correlations, root causes, and systemic bottlenecks. Simply collecting numbers on a screen is not analytics; extracting actionable insight to improve the delivery pipeline is.
The Most Important DevOps Metrics
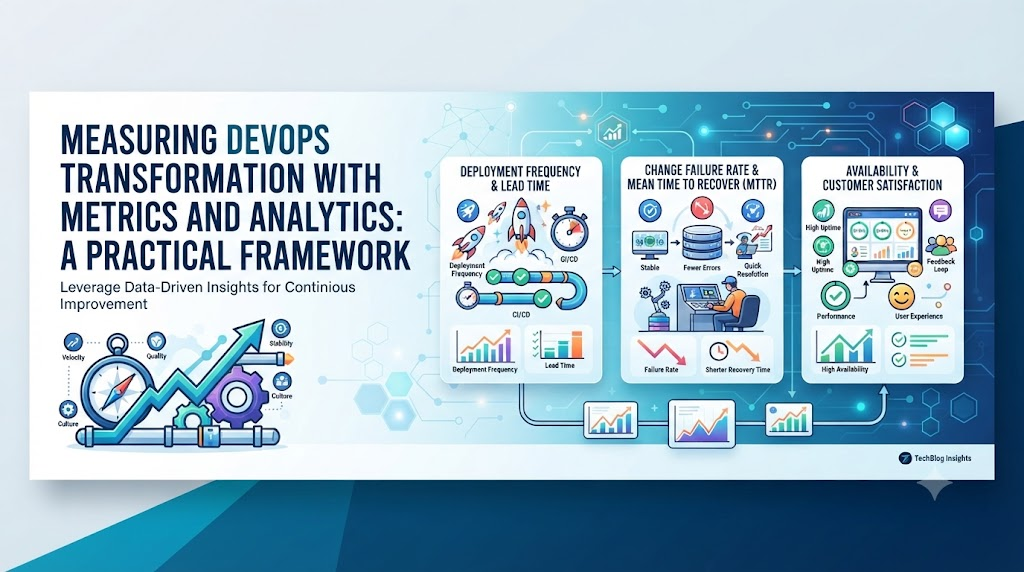
Industry research popularized by the DORA (DevOps Research and Assessment) framework highlights four core engineering metrics that effectively differentiate elite performers from low performers.
1. Deployment Frequency
Deployment frequency tracks how often code is successfully released to production or end users.
- What it measures: The cadence of value delivery.
- Why it matters: High frequency reflects streamlined automation, small batch sizes, and low friction.
- Responsible interpretation: High deployment frequency alone is meaningless if it is accompanied by high failure rates or poor customer satisfaction. It must always be evaluated alongside quality and reliability.
2. Lead Time for Changes
Lead time measures the total duration elapsed from code being committed to successfully running in production.
- Stages involved: Code commit $\rightarrow$ peer review $\rightarrow$ automated build $\rightarrow$ test execution $\rightarrow$ manual approval (if any) $\rightarrow$ production deployment.
- Bottleneck indicators: Extended lead times usually point to manual QA gates, slow code reviews, cumbersome approvals, or fragile test environments.
3. Change Failure Rate
Change failure rate tracks the percentage of production deployments that cause a failure, require an immediate rollback, hotfix, or cause a degraded customer experience.
- Release quality: This metric highlights whether speed is compromising stability.
- Context awareness: Not every production incident stems from a deployment; organizations must consistently define what constitutes a deployment-related failure.
4. Mean Time to Restore (MTTR)
MTTR measures how long it takes an organization to recover from a production service outage or critical incident.
- Phases tracked: Incident detection $\rightarrow$ diagnosis $\rightarrow$ mitigation $\rightarrow$ recovery $\rightarrow$ validation.
- Observability link: Strong monitoring, automated alerts, and runbooks directly drive down recovery times.
Reliability and SRE Metrics
DevOps practices must integrate with Site Reliability Engineering (SRE) principles to ensure production stability. Key reliability indicators include:
- Service Availability: The percentage of time a service remains operational and accessible.
- Error Rates: The proportion of failed requests relative to total requests.
- Latency: Response time percentiles (e.g., P95, P99) measuring user experience.
- Service-Level Objectives (SLOs) and Error Budgets: Quantifiable targets for reliability that dictate how much risk an engineering team can safely take.
Quality Metrics
Speed means little if software quality collapses. Organizations should monitor:
- Defect Escape Rate: Bugs discovered by customers in production versus those caught internally.
- Test Pass Rates and Stability: Flaky tests undermine trust in CI pipelines.
- Automated Test Coverage: While coverage alone does not guarantee quality, tracking meaningful test paths helps prevent regression failures.
Security Metrics (DevSecOps)
Measuring security maturity shifts protection left into the development lifecycle. Important indicators include:
- Vulnerability Remediation Time: How quickly identified security flaws are patched.
- Security Test Coverage: Integration of static and dynamic application security testing (SAST/DAST) in pipelines.
- Dependency Risks and Secrets Detection: Proactive scanning of open-source packages and accidental credential leaks.
Automation and Infrastructure Metrics
To evaluate operational efficiency, engineering teams look at:
- Manual Steps Eliminated: Tracking automation adoption across deployment and provisioning.
- Infrastructure Provisioning Time: How long it takes to spin up staging or production environments using Infrastructure as Code.
- Cloud Cost Trends: Correlating resource utilization and infrastructure drift with architectural changes.
Developer Experience Metrics
Developer experience (DevEx) directly impacts retention and delivery velocity. Key tracking areas include:
- Pipeline Waiting Time: Build and test duration.
- Environment Provisioning Friction: Time spent waiting for staging environments.
- Operational Toil: The amount of time engineers spend on repetitive manual chores rather than feature development. Surveillance-style individual productivity scores should be strictly avoided in favor of systemic flow metrics.
Customer and Business Metrics
Ultimately, technical metrics must connect back to business outcomes:
- Customer Satisfaction and Support Ticket Volume: Reflecting real-world stability.
- Time to Market: How rapidly new business capabilities reach users.
- Revenue-Impacting Incidents: Financial cost of downtime.
DevOps Metrics Dashboard Structure
A practical enterprise DevOps dashboard organizes metrics into logical categories:
| Category | Core Metrics Tracked | Primary Purpose |
| Delivery | Deployment Frequency, Lead Time | Measure velocity and flow. |
| Reliability | Change Failure Rate, MTTR, Availability | Monitor stability and recovery. |
| Quality | Defect Rate, Test Stability, Build Failures | Track release integrity. |
| Security | Vulnerability Remediation, SecTest Coverage | Evaluate security posture. |
| Developer Experience | Pipeline Duration, Provisioning Time | Measure internal friction. |
| Business | Service Performance, Operational Costs | Connect IT to business outcomes. |
How to Establish a Baseline
Before introducing new tooling or process changes, organizations must baseline their current state using a structured workflow:
- Identify Current Processes: Map out existing code-to-production workflows.
- Define Existing Metrics: Gather baseline data from source control, CI/CD, and ticketing systems.
- Establish Baseline Values: Record historical averages over a 30-to-90-day window.
- Identify Bottlenecks: Pinpoint where delays and failures cluster.
- Define Improvement Goals: Set realistic targets based on context and maturity.
- Implement Changes: Introduce targeted automation or process adjustments.
- Measure Again: Track post-implementation data.
- Compare Trends: Analyze long-term trends rather than reacting to single weekly anomalies.
Leading vs Lagging Indicators
A balanced measurement strategy combines both indicator types:
- Leading Indicators (Predictive): Automation adoption, test coverage growth, and pipeline improvements. These signal future performance gains.
- Lagging Indicators (Outcome-based): Production incidents, MTTR, and change failure rates. These confirm historical performance.
Using Analytics to Identify DevOps Bottlenecks
Analytics transform raw data into root-cause investigations. For example, if a team notices an increasing lead time:
- Metric: Lead time jumps from 3 days to 9 days.
- Investigation: Analytics reveal the delay occurs primarily during code review and QA staging.
- Root Cause: Manual code review handoffs and unstable staging environments.
- Improvement: Implement automated peer-review rules and ephemeral preview environments.
- Measurement: Verify lead time normalization in subsequent sprints.
Correlation vs Causation and Metric Gaming
Organizations must exercise analytical rigor. If deployment frequency increases following a cloud migration, analytics must verify whether the migration caused the velocity boost or if concurrent product simplification was the primary driver.
Furthermore, metric gaming—such as splitting large deployments into tiny artificial commits just to boost deployment frequency numbers—destroys data integrity. Teams must evaluate outcomes holistically rather than optimizing individual dashboard counters.
Building a DevOps Analytics Strategy
Developing a sustainable measurement program requires a step-by-step strategy:
- Define business objectives.
- Identify engineering outcomes.
- Select relevant metrics.
- Standardize metric definitions.
- Establish baselines.
- Centralize reliable data collection.
- Build unified dashboards.
- Analyze long-term trends.
- Pinpoint workflow bottlenecks.
- Implement targeted improvements.
- Re-measure performance.
- Continuously refine the framework.
Tools and Data Sources for DevOps Analytics
DevOps analytics draw telemetry from across the engineering toolchain, including source control systems, CI/CD runners, issue tracking platforms, incident management software, monitoring and observability suites, cloud infrastructure providers, and automated security scanners. Integrating these data sources into a unified analytics platform maintains single-source-of-truth reliability.
The Role of AI and AIOps in DevOps Analytics
Artificial intelligence and AIOps assist modern engineering teams by automating anomaly detection, correlating multi-tier incident alerts, forecasting cloud capacity trends, and accelerating root-cause investigation. However, AI models depend heavily on data quality, remain prone to false positives, and cannot replace human engineering judgment and contextual oversight.
Professional Growth and Learning with DevOpsSchool
Mastering the complexities of DevOps transformation, metric frameworks, CI/CD automation, cloud architecture, and site reliability engineering requires structured education and practical competency. Organizations and professionals looking to deepen their technical capabilities often look to structured training programs.
As a prominent provider in this domain, DevOpsSchool offers comprehensive learning paths covering DevOps fundamentals, container orchestration with Docker and Kubernetes, Infrastructure as Code, continuous integration, DevSecOps, performance tuning, and SRE methodologies. These programs help engineers and technology leaders bridge the gap between theoretical tool adoption and measurable operational excellence.
Future of DevOps Metrics and Analytics
As engineering systems grow increasingly complex, measurement practices are evolving toward predictive analytics, automated anomaly detection, value stream intelligence, and developer experience analytics. The future belongs to organizations that seamlessly connect low-level technical telemetry with high-level business outcomes.
Frequently Asked Questions
What are the most important DevOps transformation metrics?
The most widely recognized core metrics include Deployment Frequency, Lead Time for Changes, Change Failure Rate, and Mean Time to Restore, supplemented by reliability and developer experience indicators.
How do you measure DevOps success?
DevOps success is measured by evaluating sustained improvements in software delivery speed, system reliability, security posture, and developer efficiency over time.
What are DORA metrics?
DORA metrics are four key software delivery performance metrics—Deployment Frequency, Lead Time for Changes, Change Failure Rate, and Mean Time to Recovery—validated by extensive industry research.
Why are DevOps metrics important?
Metrics remove guesswork, highlight operational bottlenecks, track the impact of engineering changes, and align technical improvements with business goals.
How can organizations measure DevOps maturity?
Maturity is measured by evaluating an organization’s level of automation, feedback loop speed, reliability practices, and ability to deliver value safely and repeatably.
What is the difference between metrics and analytics in DevOps?
Metrics are individual data points tracking specific indicators, while analytics involve interpreting those data points over time to uncover trends, root causes, and improvement opportunities.
How can DevOps metrics identify bottlenecks?
By analyzing stage-by-stage durations—such as isolating where code spends the most time between commit and release—teams can pinpoint exact operational friction points.
How should organizations avoid metric gaming?
By focusing on balanced indicator frameworks that combine speed with stability, encouraging team-level collaboration rather than individual ranking, and evaluating holistic system outcomes.
Final Thoughts
DevOps transformation is a continuous engineering journey rather than a destination marked by tool installation. Effective measurement ensures that an organization understands where its systems struggle, verifies whether improvements are working, and uses hard data to make informed decisions.
The goal of DevOps measurement is not to build the biggest dashboard. It is to understand where engineering systems are struggling, determine whether improvements are working, and use evidence to make better decisions.

Best Cardiac Hospitals Near You
Discover top heart hospitals, cardiology centers & cardiac care services by city.
Advanced Heart Care • Trusted Hospitals • Expert Teams
View Best Hospitals